Data management: establishing good practice
Technology allows us to continuously measure things to ever-increasing levels of accuracy, and gather massive amounts of data in real time. But if the data doesn’t support and inform discussions that lead to achieving a good plan are achieved and improvements in what we are doing, then gathering the data becomes an exercise in futility.
Context
Over the last 30 years the data gathered by mining operations has grown exponentially. When I started working in the industry in 1987, the shift engineer tallied the truck numbers, material sources and destinations from shift reports, and PLODS, scribbled by operators as they pulled away from a shovel. Well that was what we hoped for, more often operator’s reports were updated at crib, smoko, or queuing; with the operator adding roughly what they thought they had done since the last entry. And the data we gathered was stored and analysed on sheets of paper. We thought HP programmable calculators were pretty cool.
Now we have real time data gathering through telemetry systems. Amazingly accurate GPS tracks locations and ensures shovels are digging within centimeters of where they are planned to be, and blast holes are drilled exactly in the design location. And data is flooding continuously onto the sites’ servers.
But does this lead to a better understanding of how the operation is performing? And does it lead to better performance?
When I started doing cross-sectional benchmarking, comparing sites, in 2001, what quickly became apparent was that sites were almost drowning in data. But the torrent of numbers gathered by the newly implemented truck dispatch systems were more often than not channelled into the “data hut” and forgotten about. Yes, the supervisors got some fantastic real time feedback but the deep information and insight this data could have provided was barely touched upon. And at many sites this is still the case. You go to a daily meeting with the managers, supervisors, operators and maintainers and there be will walls papered with charts showing trends of KPIs. And they are all KPIs, all 63 charts are KPIs.
First, there are not 63 KPIs for an operation, there are about five. Everything else is data that feeds into and informs these KPIs. This is the data you drill down on when the KPIs do not align with the plan. And secondly, good performance is not a high or low number, it is achieving a good plan, it is doing what you said you would day in day out.
A regular argument you hear is that each person needs KPIs they are responsible for, normally in isolation. I disagree with this, it builds silos and focuses on elements of the process rather than the process as a whole. Everyone should be responsible for the small number of true KPIs and be focussed on how their area of responsibility affects how the mine makes money.
What is a KPI?
Now to the difficult part, what are the site’s KPIs? We have all heard it said by a manager that they only need to monitor three things to run their operation, they just don’t know what those three things are.
This gets to the underlying problem we see at many operations, there is no consolidated view on how the operation makes the most money sustainably. I prefer this to the rather nebulous “create value”. The main reason for this lack of a consolidated view is that getting an agreement can be hard, and it is easy to default to the “move rock as cheap as possibly option”. This is invariably the wrong answer. A much better starting point for the mine is to deliver the plant the right quantity, grade and blend of feed to maximize its output; then do this as cheaply as possible. I don’t recall seeing a case where moving rock cheaply did more for the bottom line than getting the plant singing. KPIs might include minimising the drill and blast unit cost, but I doubt it. The investors are unlikely to be elated if the unit cost of breaking rock has been driven to record lows if there is not sufficient material to provide the plant with the quality and quantity of feed it requires to maximize the plant output.
The definition I like for KPIs is:
“Measures that ensure you’re staying on track to make the money you planned to make; sustainably, in the short, medium and long term.”
And this requires a consolidated view on how the operation works and makes money.
Common Understanding
Defining how the operation is going to work is inevitably about variability. When the geologists are developing the resource they drill holes 25m, 50m or 100m apart, they then use the samples gathered to identify shapes, domains, contacts etc. From this they estimate the tonnes and grade of the mineralization. And this is the point, it is an estimate. We know there is uncertainty, and that there will be variability between what we estimate is there and what is actually there. In fact, the geostatistical methods that are common can provide real insight into what the potential variability might be.
This contrasts with the desires of the metallurgists. If there has been one over-riding observation I can make from my dealings with metallurgists, it is that they value consistency. Given any particular increment of mineralization, a week, a month, a year’s production; if that can be fed as a homogenous feed with no variability in the grade, hardness and impurities, they can do the best possible job of extracting the valuable part of it. Operating and planning without understanding and accepting the inherent variability in the resource model will lead to reacting to noise and having plans that are almost impossible to achieve. And no amount of data and discussion will make this better.
One site I was involved with had extremely high short range variability in grade, but a resource model that reconciled fantastically in the medium to long term; they thought it was a significant issue when the metal fed on an annual basis went outside 3% of the model prediction. Despite this, when the daily plant grade fluctuated outside the anticipated parameters, they would relocate to an area outside the plan hoping for an improvement. The reality was that the chances of getting an increase in the grade were just as high if they stayed where they were. Because they didn’t understand the inherent variability and how it influenced their operation, they just reacted to noise, became inefficient and did not achieve their plans.
Another example was a site where the crusher ran at maximum capacity up to certain BWI, above this, throughput started to decrease. The annual plan targeted an average BWI equal to the highest that still achieved the maximum crusher throughput. But the year was made up of a distribution of hours or days feeding a distribution hardnesses’. And when it exceeded the limit hardness throughput was lost, but it could not be recovered when the hardness dropped below the limit. This meant that when the variability of the resource was considered, the plan could not be achieved.
These examples highlight how the way the sites operated and planned had not taken into account managing the inherent variability of the mineralization, and this made the plans unachievable. There was no common understanding of how mineralization can be best exploited through the whole system.
So what has this got to do with data and how we can get the best value from what is gathered? Without a context, a conceptual model of how the operation intends to make the most money, then data gathered is going to be random metrics with at best a tenuous link to making money.
An example might be where there are large cut-backs to be mined to access ore, and the initial goal of the mine is ensuring the next block of ore is exposed before the previous one is exhausted. Once the ore is exposed you can manage it to get the best blend. Here the KPIs could be bench turnover rates and exposed ore stocks.
Another good example is when a site decides to build discrete blended stockpiles, which are completed and closed before they are reclaimed and fed to the plant. When this approach has been implemented then the role of the mine becomes more specifically defined than “feed the plant with the best ore”. It is to build defined stockpiles within specific tolerances ensuring there are sufficient quantities to feed the plant reliably, and then to ensure the costs are kept as low as possible. The KPIs for this might be blended ore stocks, exposed ore in the pit, total rock mined, hourly variability in plant feed quality and quantity, and cost. When these fall outside specific tolerances then the metrics that support them need to be reviewed. Stocks are a great KPI as they are the best indicator of future performance.
This is not intended to suggest that blended ROM stockpiles are the best possible approach to managing grade variability at every mine. If a site has homogenous geological and metallurgical parameters, then direct tipping and keeping cost low might well be the best way forward, but the answer will be specific to the operation. Or there might be options for managing the feed variability by digging ore from a number of locations and ensuring ore is always fed from at least a minimum number of locations. The important issue here is that whatever the process is, it is explicitly defined and understood by everyone.
This is defining the system you’re going to have, and while this doesn’t have to be fixed in stone, revising and changing it should be part of the strategic planning process with new options tested, analysed, compared to the existing process and implemented if it has been proved to be better.
When there is an explicit understanding of how the operation makes money, then the plans and most importantly the conversation on how to get the most out of the operation, can be focussed on what matters, making the process work as well as it can.
Linking the process to the Metrics
If you’re going to put time and effort into gathering data, you want to make sure you are getting the right numbers and understand what they are telling you. This is where the context we have discussed is vital.
Continuing with the example of drill and blast, is a high utilization of your drill fleet good? Well it depends, if you’re mining a massive bulk deposit with large working areas, possibly. But if your way of maximizing money from the mine requires a high bench turnover, one of the fundamental drivers of good performance will be ensuring there are no delays in the drill, blast, load, haul, and bench preparation cycle. So that means you don’t want to be waiting for a drill. You need the pattern finished and ready to fire by the time the face is clear, the drill has to be available as soon as the pattern has been prepared. No amount of cost saving from drilling is going to make up for the plant having no feed for a week.
The graph below shows availability, utilization and operating hours achieved from drills in the AMC Benchmarking database.
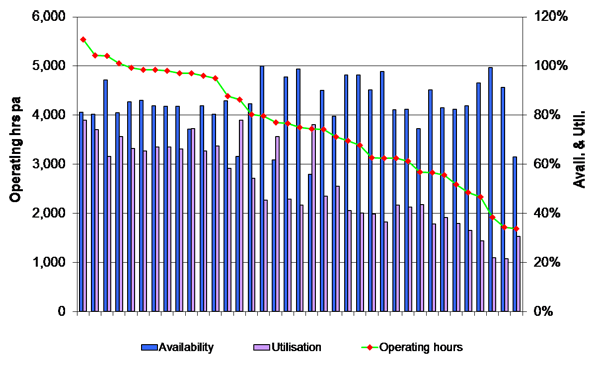
In this situation, while sites achieve around 5,000 hrs pa, planning closer to 4,000 hrs pa may well be required to ensure the bench turnover is achieved. It is all about understanding what you’re trying to achieve from the operation and setting the right parameters to achieve that.
So once there is a conceptual understanding of how the operation makes money, you can develop a process flow, then link the mining activities to this flow with driver trees mapping the various metrics gathered by the site systems, showing how they relate to the KPIs. This should then provide the basis for planning, measurement, reconciliation and improvement.
The diagram below shows an example of a process flow and driver tree where the main issue is ensuring the ore production areas are stripped ahead of requiring the ore.
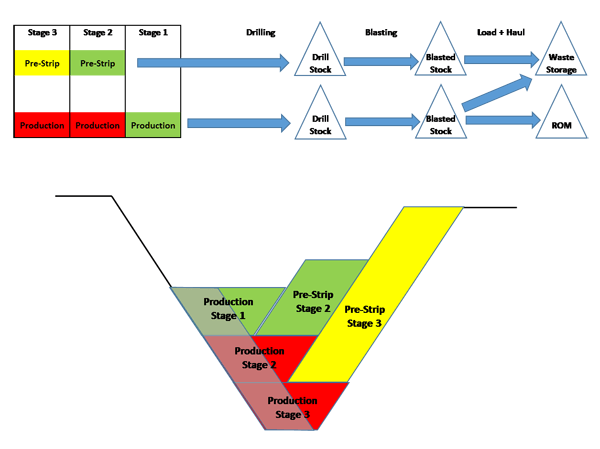

The process flow and driver trees should be no more complex than required. Longer term KPIs might be production stocks exposed and pre-strip bench turnover rate, and the shorter term ones might be the drilled and blasted stocks. But as we discussed before, delays in drilling may be critical, so you might introduce into the data gathering system a way of flagging when a block becomes available for drilling and when drilling commences. This may be one of the three things the manager needs to monitor to make the operation run really well. It is worth noting that the KPIs suggested are not ones that fall easily out site data systems so it is vital to define what you want from the system and then design the system around the requirements.
It is interesting to note that the suggested KPIs are generally around material movement, and the supporting metrics in the driver trees are more focussed on the equipment performance. You should expect this as the operation is there to take mineralization and turn it into a product you can sell, not to get a high truck utilization. If the truck utilization facilitates turning the mineralization to product and doing it as cheaply as possible then great, but it isn’t a KPI.
As a general observation from benchmarking and review projects, while sites generally monitor equipment performance relatively well, it is much less common to see this linked to the flow of material from the resource model to the plant. And this is where you start to get the insights. If you can link powder factors or drill penetration to shovel productivities and crusher throughput you can start to really understand how to maximize the profit from the mine.
So once you have this generally accepted understanding of how the operation makes money and a framework for compiling and analysing the data, what are the right values for the metrics in the plan?
There is value in cross sectional comparisons, comparing your machines to similar ones is useful, it gives an idea of how you compare to the field, but it does little to explain why your performance is at the level it is at. And worse still using this type of data to set a target without some idea of why your site is where it is, and what are potentially achievable outcomes given the site’s constraints, can set the operation up to fail.
The data in the graph shows two shovels compared to the AMC benchmarking database.
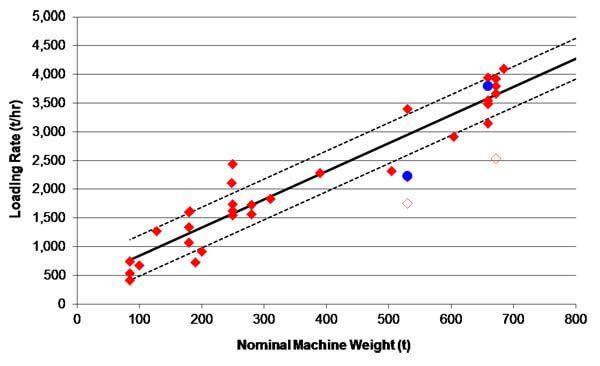
The data tells us one site is doing well compared to its peers, while the other is doing relatively poorly. But what do you see when you look at a time series of the data.
The graphs show a year of shift on shift data for these machines in process control charts and histograms.
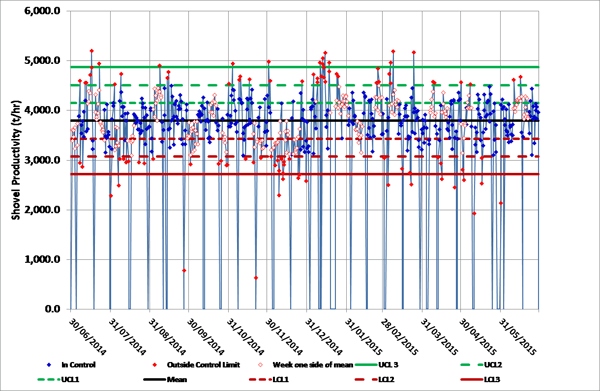
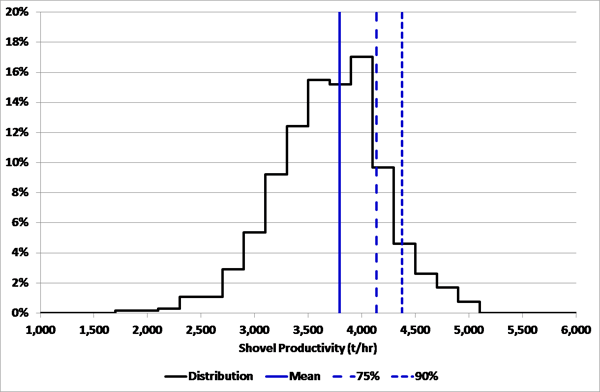
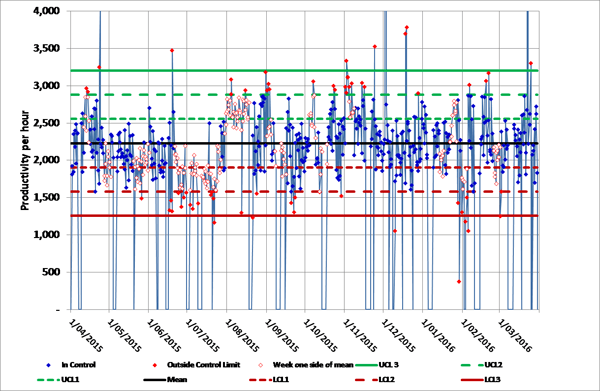
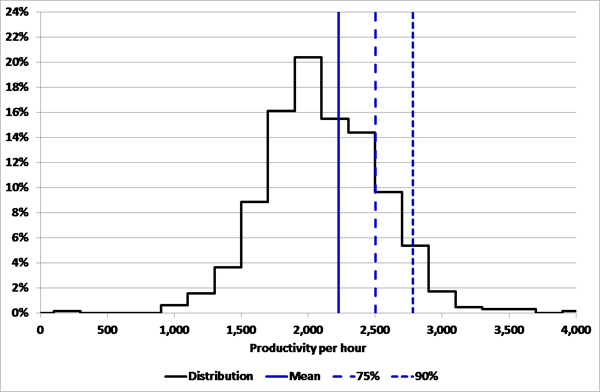
What is immediately apparent from this data is that the site with the better performance has a much tighter distribution. In the first case the standard deviation is 14% of the mean while in the second case it is 21%. The trend from the database for the smaller of the two machines is around 2,900 t/hr, which is above the 90th percentile of the site performance. While it might be reasonable to ask this site what went well when they averaged 2,700 t/hr for two weeks and what went wrong when they averaged less than 2,000 t/hr for more than two months, blindly stating that they should be getting close to 3,000 t/hr does not help anyone.
To tell an operation it should be getting best in class performance when the weather, the nature of the material, and the level of skill of the local work force are all against them is of little value to anyone.
Conclusion
Data gathering and analysis should not be an end in itself, it is only of value when it supports maintaining a stable and efficient operation. And the plan targets should take into account what can be achieved based on the given geography and geology of the site.
Going back to a comment made early in this discussion, good performance is about achieving a good plan, doing what you said you would day in and day out. And this is achieved by having a balanced operation where the interactions between functions and activities are understood and the focus of manager and supervisors spans these interactions. Everyone should be looking at what the whole process achieves, not what their small part of it achieves. So good practice in data management should ensure the data being gathered and the information being provided supports an agreed overall view of the operation.
So my key points are:
- Have an agreed view on how the operation can best exploit the ore body.
- Clearly define the small number of KPIs that tell you whether the process is operating how you planned.
- Have a clear structure relating the data you gather to the KPIs and the process.
- Gather, report and discuss data because it helps, not just because it is easy to get.

Stoddart, James
Principal Mining Consultant
Subscribe for the latest news & events