Mineral Resource Validation
Introduction
Almost all Mineral Resources reports prepared in accordance with international codes (e.g. JORC, NI43-101) contain a section called Mineral Resource Validation. The purpose of this section is to validate the accuracy of the estimated block grades used for stated Mineral Resources. When the model has been developed for a deposit being mined, the truest validation is usually against mine or mill production. In addition there is the opportunity to compare the modelled grades against a more detailed model based on closer-spaced data obtained during grade control drilling or sampling. These are usually addressed under a Reconciliation section of the report, but are not discussed further here.
This article looks at recent changes in validation methods and expands upon the ideas presented by Jacquie Coombes in Validation of Resource Models – Myths, Materiality and Modern Approaches (Coombes, 2009).
Generally the results from a number of validation methods should be considered, as the results from any one or two methods are rarely sufficient to adequately check the estimated block grades.
The most common methods of validation are:
- Visual inspection in section and plan comparing the block model grade distribution to the original drillhole and other sample grades.
- Creation of swath plots comparing the block grade distribution to the sample grade distribution along coordinate lines and elevation.
- Comparison of primary estimated block grades based on the results of using alternative estimation methods.
- Global summary statistics comparing the composite grades to the block grades.
- Comparison with previous Mineral Resource estimates.
Validation methods
Each of these methods, although they act as a check against the model, also have issues that should be taken into consideration when relying on the validation results.
Visual inspection
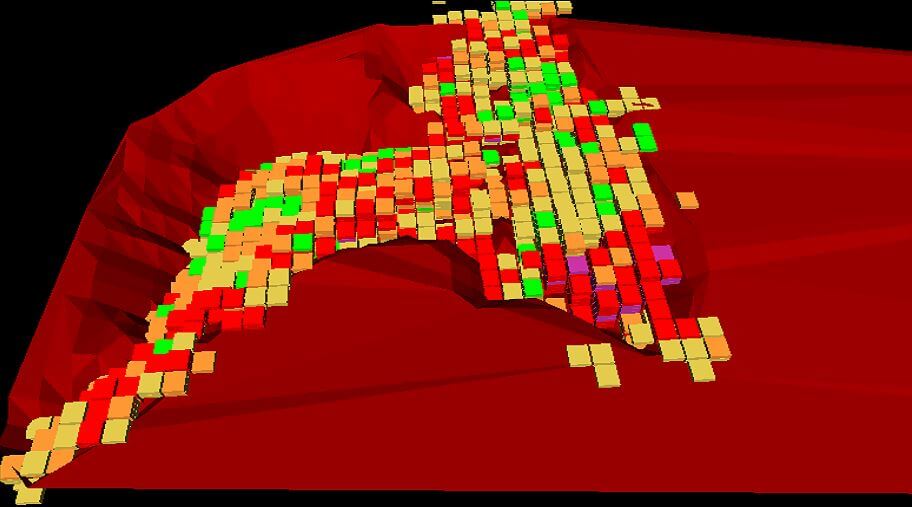
Visual inspection highlights areas of unestimated blocks and possible negative grades, along with the agreement between the estimated grade with the original assay data. The visual comparison of block models and drill sample data is generally completed in plan and along cross-sections aligning with the dominant drill direction, with only one line or level of drillhole data being viewed at a time. This results in the lower or higher grade intervals on adjacent sections or even between sections being hard to visualize. It is recommended that additional sections that lie orthogonal to the drillhole section lines are also viewed. This will allow a more detailed appreciation of the continuity of grade to be gained, and highlight areas between sections where areas of poor estimation have occurred.
Swath plots
Swath plots are designed to compare two sets of data. Commonly used data are the declustered sample grades used for the estimation against the block grades. The plot takes an average grade over set intervals in a specific direction (e.g. north-south sections at a constant 50 m interval). Alternatively, block grades estimated using two different estimation methods may be compared to identify differences created by using the different estimation techniques. These plots only show averages over intervals and not the local block grade estimates. The following should be avoided:
- Inclusion of sub-blocks.
- Inclusion of all sample data rather than declustered, composited, top-capped data.
- Inclusion of blocks below or outside the area of drilling.
A grade bias can be identified if the primary swath line is consistently above the validation swath line (biased high) or if the primary swath line is consistently below the validation swath line (biased low).
Swath plots can also identify grade smoothing to a certain degree. If the peaks and troughs of the primary estimation method have noticeably lower peaks and higher troughs than a Nearest Neighbour (NN) swath plot, this is a strong indication that grade smoothing has occurred. It is then important to look at the estimation parameters (assay length versus composite length, maximum number of composites per drillhole, maximum number of composites per block grade, etc.) to determine if grade smoothing has been excessive.
Comparison of model block grades using different estimation methods
Comparing the estimated block grades by the preferred method against the grades estimated using alternative methods does not generally validate the estimated block grade. This comparison generally only highlights the different weighting applied to the individual sample grades by the different methods. It does not take into consideration the main estimation parameters that will impact on the estimated grade. These are the search parameters (including orientation and radii), block size, minimum and maximum number of samples, minimum number of holes used, composite length, grade domains, discretization, etc. Single sample NN estimates should compare well with the input sample data statistics, but do not allow for any trends in the mineralization or differences between grades based on a block size and sample grades. When inverse distance to the power of three (ID3), or to a higher power, is used as the main estimation method and compared to NN, there should always be a good correlation. This is because the ID method using powers greater than two applies a high weight to the closest sample/s, resulting in an almost NN estimate.
Comparing NN block grades estimates to ordinary kriging (OK) block grades estimates should give very similar results to comparing sample grades to the OK estimates.
Global statistics
With this method, the block grades are compared to the declustered, composited sample grades. The comparison should use top-capped values, if this has been employed. This exercise can be done by domain as long as the population is statistically meaningful. It will give general information comparing the mean values (which should be similar) while the block grade variance should be smaller than the composited sample data. It does not provide information on the local estimates or whether correct domaining of the mineralized areas has been used, and can be misleading due to the following:
Sub-blocks biasing results (the grades of sub-blocks given the same statistical weighting as a parent block);
Including blocks estimated outside the area of drillhole information. This can create a low grade bias for the model grade;
The impact of grade/geology domaining and mineralization trends;
Comparison with previous estimates
Although comparison with the previous Mineral Resource estimate is an essential part of a good Resource report, caution has to be exercised when using the results as a means of validating the new estimate. This is because of the changes that may have occurred between the two estimates, such as new data, mine production, differences in the estimation method, domaining, variography, search parameters, etc., even a change in the person undertaking the estimate. If the changes are relatively minor, a comparison between the two estimates may help to validate the new estimate (or conversely, invalidate the previous estimate).
Comparison with historically reported Mineral Resource estimates, where the input data cannot be validated or is no longer available or parameters and estimation method is not known, does not validate a Mineral Resource.
Other methods to consider
A number of other checks on the estimated block grades should also be included in the validation:
- Volumetric comparison – compare the volumes of the wireframe solids to the total block volumes to ensure the sub-blocking is appropriate.
- Other statistical checks including quantile-quantile (QQ) and probability (PP) plots.
- Comparing the declustered sample statistics to the block grades, based on the estimation pass. The first pass should have closer spaced data, and often higher grades, while the last pass would have limited data and therefore have increased variability between block grades and sample grades with higher kriging variances.
Recommendations
AMC recommends the following checks be undertaken to confirm the estimated block grades are appropriate, based on available data and a good understanding of the geology:
- Ensure the search parameters are adequate for the trends in mineralization – not too tight a search ellipse that would result in limited samples per estimate (similar to NN).
- Ensure the longest search axis is in the direction of greatest grade continuity, shown by the variogram.
- Check that the number of samples used to estimate the block grades is not so large that each block has a global grade estimated instead of a local grade (i.e. over-smoothed).
- Carry out a visual comparison comparing the block grades with the sample data used for the estimate, focusing on the very high and low grade blocks, and block grades around the margins of the deposit where there is limited data. Also look in all three directions (plan, cross-section and longitudinal sections) and between drill sections.
- Prepare swath plots based on constant block size and only for the area of drilling. Look at each estimation domain separately, as one domain biased high can be offset by another domain biased low, resulting in a global estimate that appears unbiased.
- Compare the declustered composited sample statistics to the statistics of constant size block grades.
- Compare the statistics between the estimated block and NN grades.
- Ensure the estimated density values are consistent with the geology and check whether they are correlated to the grade.
- Review the kriging variance and check the areas of high variance indicating poorly estimated block grades.
- Ensure the estimated density values are consistent with the geology and that they are correlated to the grade.
- For total block estimation, ensure the sum of individual elements does not exceed 100%. An example would be a mineral sands deposit where the sum of the estimated heavy minerals, slimes and over size material, contained within the sand, cannot be greater than 100%.
Conclusion
There is no single method of comparing the drillhole sample data to the estimated block grades that can simply validate a block model and Mineral Resource estimate. Even reconciliation with the tonnes mined and milled may not definitively confirm the estimated block grades due to issues with mining due to dilution, mining losses ore/waste going to the wrong stockpile pile and mill losses.A number of checks must be carried out with full consideration given to the geology and trends in mineralization. Most importantly, it is the responsibility of the Competent or Qualified Person to not just perform a standard checking procedure, but to interpret the output model based on experience and to consider if it matches the available data, including the geological interpretation of the deposit being estimated.
Reference
J Coombes 2009 “Validation of Resource Models – Myths, Materiality and Modern Approaches”. AusIMM Project Evaluation Conference
Text by Rod Webster
Subscribe for the latest news & events
Contact Details
Useful Links
News & Insights

